OFFICER INVOLVED 2017

OFFICER INVOLVED 2017
FOR THE THIRD year in a row, police officers in the United States have
killed more than 1,000 people.
How do we make sense of such a staggering number?
This week, the research collective Mapping Police Violence, led by Sam Sinyangwe, released the 2017 Police Violence Report — an analysis of data concerning every deadly run-in with law enforcement recorded this year.
“Compiling information from media reports, obituaries, public records, and databases like Fatal Encounters and the Washington Post,” the website reads, “this report represents the most comprehensive accounting of deadly police violence in 2017.” Whereas 2016 saw 1,093 people killed by the police, that number has risen to more than 1,100 today.
They allow readers to download their data. As in previous years (see the 2015 and 2016 versions of this project), I spent some time looking at the locations of these encounters. What might we see in the landscape?
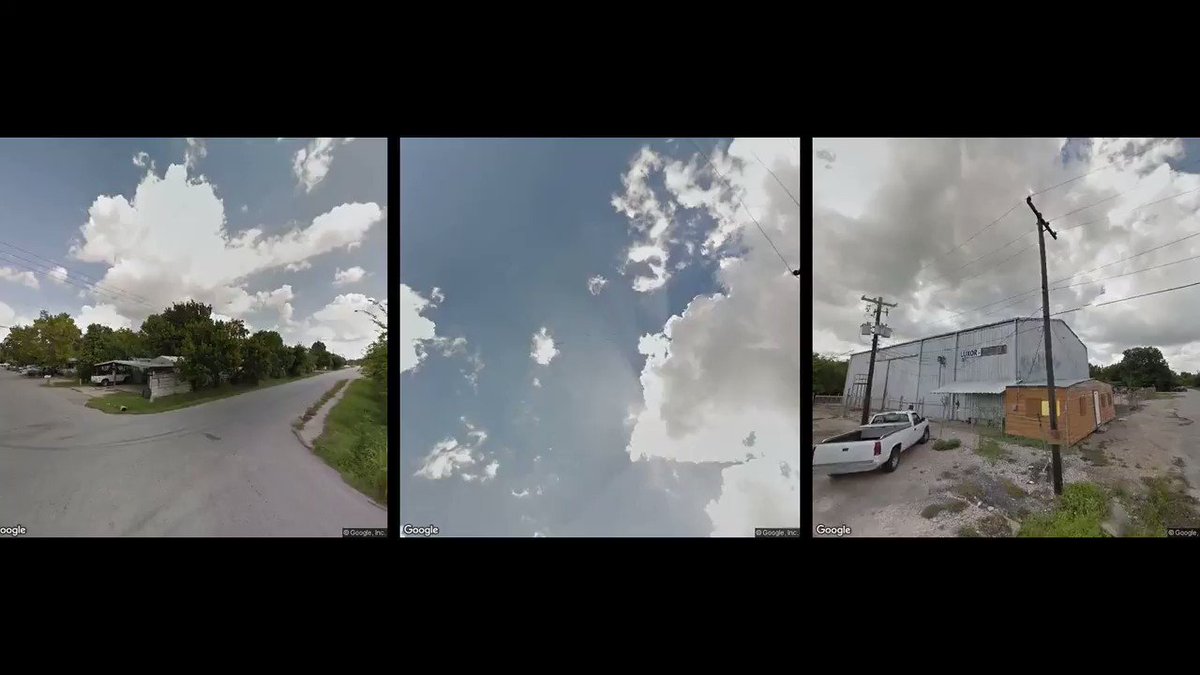
Using the Street View API, I wrote a computer script that runs each address through the all-seeing eye of Google, downloading three images for each location.
What emerges is a triptych of police brutality in 2017. Every frame you see is from one of these sites of violence.
copy https://theintercept.com/


Nenhum comentário:
Postar um comentário